
Quality Rules versus Exceptions for Complex Assays
A solid understanding of effective quality rules is essential for anyone working with LC-MS/MS
One of the most powerful instrumentation setups for the clinical laboratory is LC-MS/MS. The ability to separate analytes of interest with orthogonal methods (chromatography and mass spectrometry), the wide availability of differing chromatography chemistries, the highly selective nature of mass detection, and wide quantitative range with minimal sample volume make this device particularly attractive when there is a need to develop an assay not otherwise available on the commercial market. The ability to extend an existing instrument into a wholly new test system (e.g. vitamin D in urine, testosterone in blood, drugs of abuse in saliva) without requiring a larger footprint in the lab adds to the attraction. This combination of flexibility and complexity requires anyone who works with LC-MS/MS to develop a solid understanding of effective quality rules.
Rules Mediate Risk
There are two questions associated with any analytical measurement: “What is the result?” and “How do you know?” The first is delivered as the signal, but the second requires a deep understanding of the instrument and potential sources of error. Simple assays, such as a modern pH meter, follow a straightforward qualification procedure against a set of testing solutions. Automated assays, like a PCR viral panel, apply multiple checks and tests integrated into the device. Complex assays like LC-MS/MS require directed human action—sample preparation, instrument detection, and data review—and equally complex checks. It is these complex checks that often create the most difficulty for results management, as they come with their own risk of error that must be considered and corrected.
Mass spectrometry assays, which are mostly lab-developed, have many points of failure and require a powerful quality checking methodology. Although simple and automated assays have many of the same risks, their effects are resolved internal to the operation of the system—an autoanalyzer that displays an error code or a balance that undergoes biannual calibration.
For a complex assay, the risks become explicit and need to be resolved directly by the technical staff of the lab. Sample preparation and instrument detection errors are usually described in terms of reproducibility regarding:
- Sample handling (collection, transport, storage, provenance)
- Matrix effects (blood plasma, urine, saliva)
- Interference effects (endogenous compounds, pH, sample carryover)
- Specificity (chromatography profile, metabolites)
- Measurement (upper and lower bounds, significant figures in quantitation)
- Repeatability (accuracy and precision)
Data review necessarily begins with a detected response in order to apply a set of quality rules about signal validity. The degree of reproducibility in the assay clarifies the error limits for measurement and therefore the range and type of acceptable error. Since the signal is the only means to reveal the quality of sample preparation, or the status of the detector, or the decisions of the reviewer, it is essential to understand how different quality failures are expressed within the data. Understanding whether loss of signal is from degradation of a charge-coupled detector plate or over-dilution of a sample, for example, allows for faster root cause analysis and problem resolution.
Basic Quality Rules
There are four broad categories of basic quality rules in an LC/MS-MS assay (Figure 1).

- Chromatography Rules (internal standard response, peak asymmetry)
- Sample Rules (ion ratio, concentration overload)
- Analyte Rules (Westgard multi-rule, calibration R2)
- Batch Rules (system suitability, control matrix stability)
Based on the known accuracy and precision of the various assay components, these rules are easy to describe within an SOP and easy to implement with basic software. Observations which affect one sample do not necessarily indicate a problem with all samples, nor do the failures of one compound necessarily indicate a problem with the whole batch. This is especially important in the case of large panel assays, where a failure to calibrate morphine does not invalidate the calibration and reporting of hydrocodone.
Advanced Quality Rules
Advanced quality rules move beyond this isolating approach where data categories are independent of each other. Inherently complex by their nature, advanced quality rules involve a multi-dimensional understanding of how the system operates over time, or the correlated relationships between basic rules, or the manifold associations that can act across multiple analytes (Figure 2).

Moving beyond the basic rules costs time and expertise, often requiring complex human inspection using knowledge about specific operational conditions. This can present in a variety of ways such as personally developed (and unrecorded) exceptions to the rule, manual adjustments to automatic calculations, or mandates to include the lab manager before releasing the result. Whatever the reasoning, these advanced rules certainly exist when operating a complex assay even if they go unremarked in the documentation.
The least acknowledged of these advanced quality rules are those which become apparent over time. While a quality control chart does an excellent job of providing a retrospective statement of past performance, it is rarely used in the process of assessing and releasing results from the current batch of observations. The data exists within the laboratory instrument and LIMS, but basic assay operation expects the single batch in isolation will operate as if it were the average anticipated result.
Case Study: Internal Standard Response Over Time
The case study described below focuses on the internal standard response deviations across six months of production data on one instrument. When concentration calculations are performed on the relative response of [analyte]/[internal standard], they presume the second signal is affected by instrument conditions in an identical manner to the analyte. If that is not true, the simplest way to check sample quality is to check what should be a constant internal standard signal.

Basic Quality Expectations
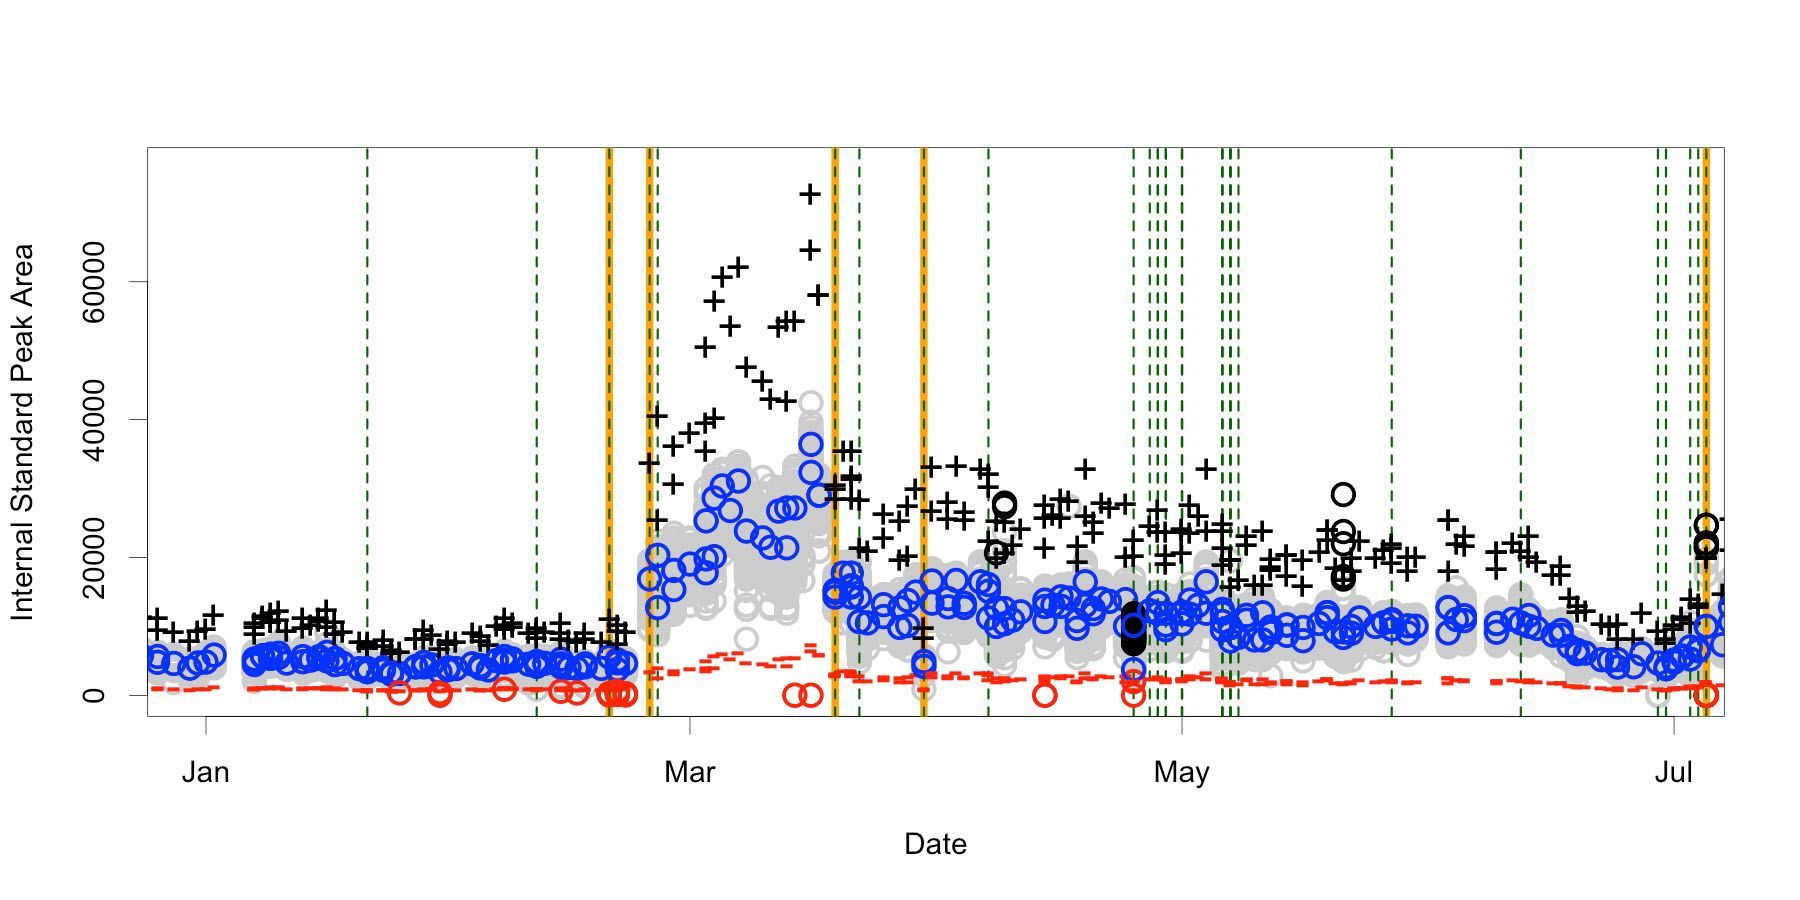
Instrument response varies widely over both long and short periods of time (Figure 3) with a median CV of 10 percent for any one batch of data but a 60 percent CV from all six months. The range of acceptable values commonly used in practice will extend from 20 percent to 200 percent of the mean found using the standard samples within the batch (called the reference target). This per-batch target is intended to control for day-by-day changes. Figure 4 shows the same data with target, upper, and lower bounds. Flagged samples are colored black above the upper bound and red below the lower.


There are at least four different signal states invisible to the basic quality rules. Without an absolute area expectation, it isn’t possible to notice a batch collected in February is objectively different from one collected in March or May. This returns us to the problem which internal standard should be correcting for, when otherwise acceptable variations in signal are excessively flagged, or plainly altered signals go unremarked.
Advanced Quality Expectations
An advanced quality rule operates on knowledge from beyond the batch. By applying 10N+1 outlier statistics, retrospective analysis establishes 24 questionable batches (Figure 5) over the six-month timeframe, providing a directed opportunity for spot checking. More importantly, the calculation is able to reveal five batches which break the pattern established from the prior ten, signaling a need to investigate the system before releasing the results.
Another obvious aspect are the large gaps between the observed areas and the basic flag boundaries. This range of “acceptable” is so wide that it usually only annotates samples missing the internal standard. Applying the information about the actual range and coefficient of variation from immediately prior batches could direct a dynamic threshold to do a better job of capturing exceptions in the current batch. Combined with the outlier batch detection, this dynamic thresholding would reset when the new batch is statistically different from the prior ones.
Basic versus Advanced Quality Expectations
There is one batch where the basic rule highlights a significant fraction of samples for excessive internal standard peak area. Two batches were collected on that date in late April, shown in detail in Figure 6A. The morning batch behaves reasonably: one sample where no peak was found (area of zero) and one sample just below the 20 percent boundary. The afternoon batch presents a smaller mean and an upper bound well inside the overall spread. Plotting that second batch by index in Figure 6B exposes a drastically smaller peak area in the calibrator observations—which were collected first—compared to those after index 50. The expectation for batch consistency has not been met, but the basic quality flag implies the instrument is uncontrolled. Advanced quality analysis of the batch shows it was not an outlier upon collection and indicates the system continues to operate as expected. In this instance, the basic test is flawed.

Concluding Remarks
Basic quality rules are easily and routinely applied to mass spectrometry assays across the laboratory. So are the advanced quality rules, but perhaps not explicitly so. A lab manager signing off on a result questioned by a technician, or a technician remembering “that one time” are both exercising an otherwise undocumented and advanced rule. Critically, solutions exist today which enable an explicit review of the current batch using data already collected from beyond the batch. The lab can move past a reliance on a meaninglessly wide tolerance and consider the system as it really is. In the next case study, basic quality rules consistently treated as exceptions-in-practice can also be turned into advanced quality rules by including the secondary observations under consideration when creating the exception.